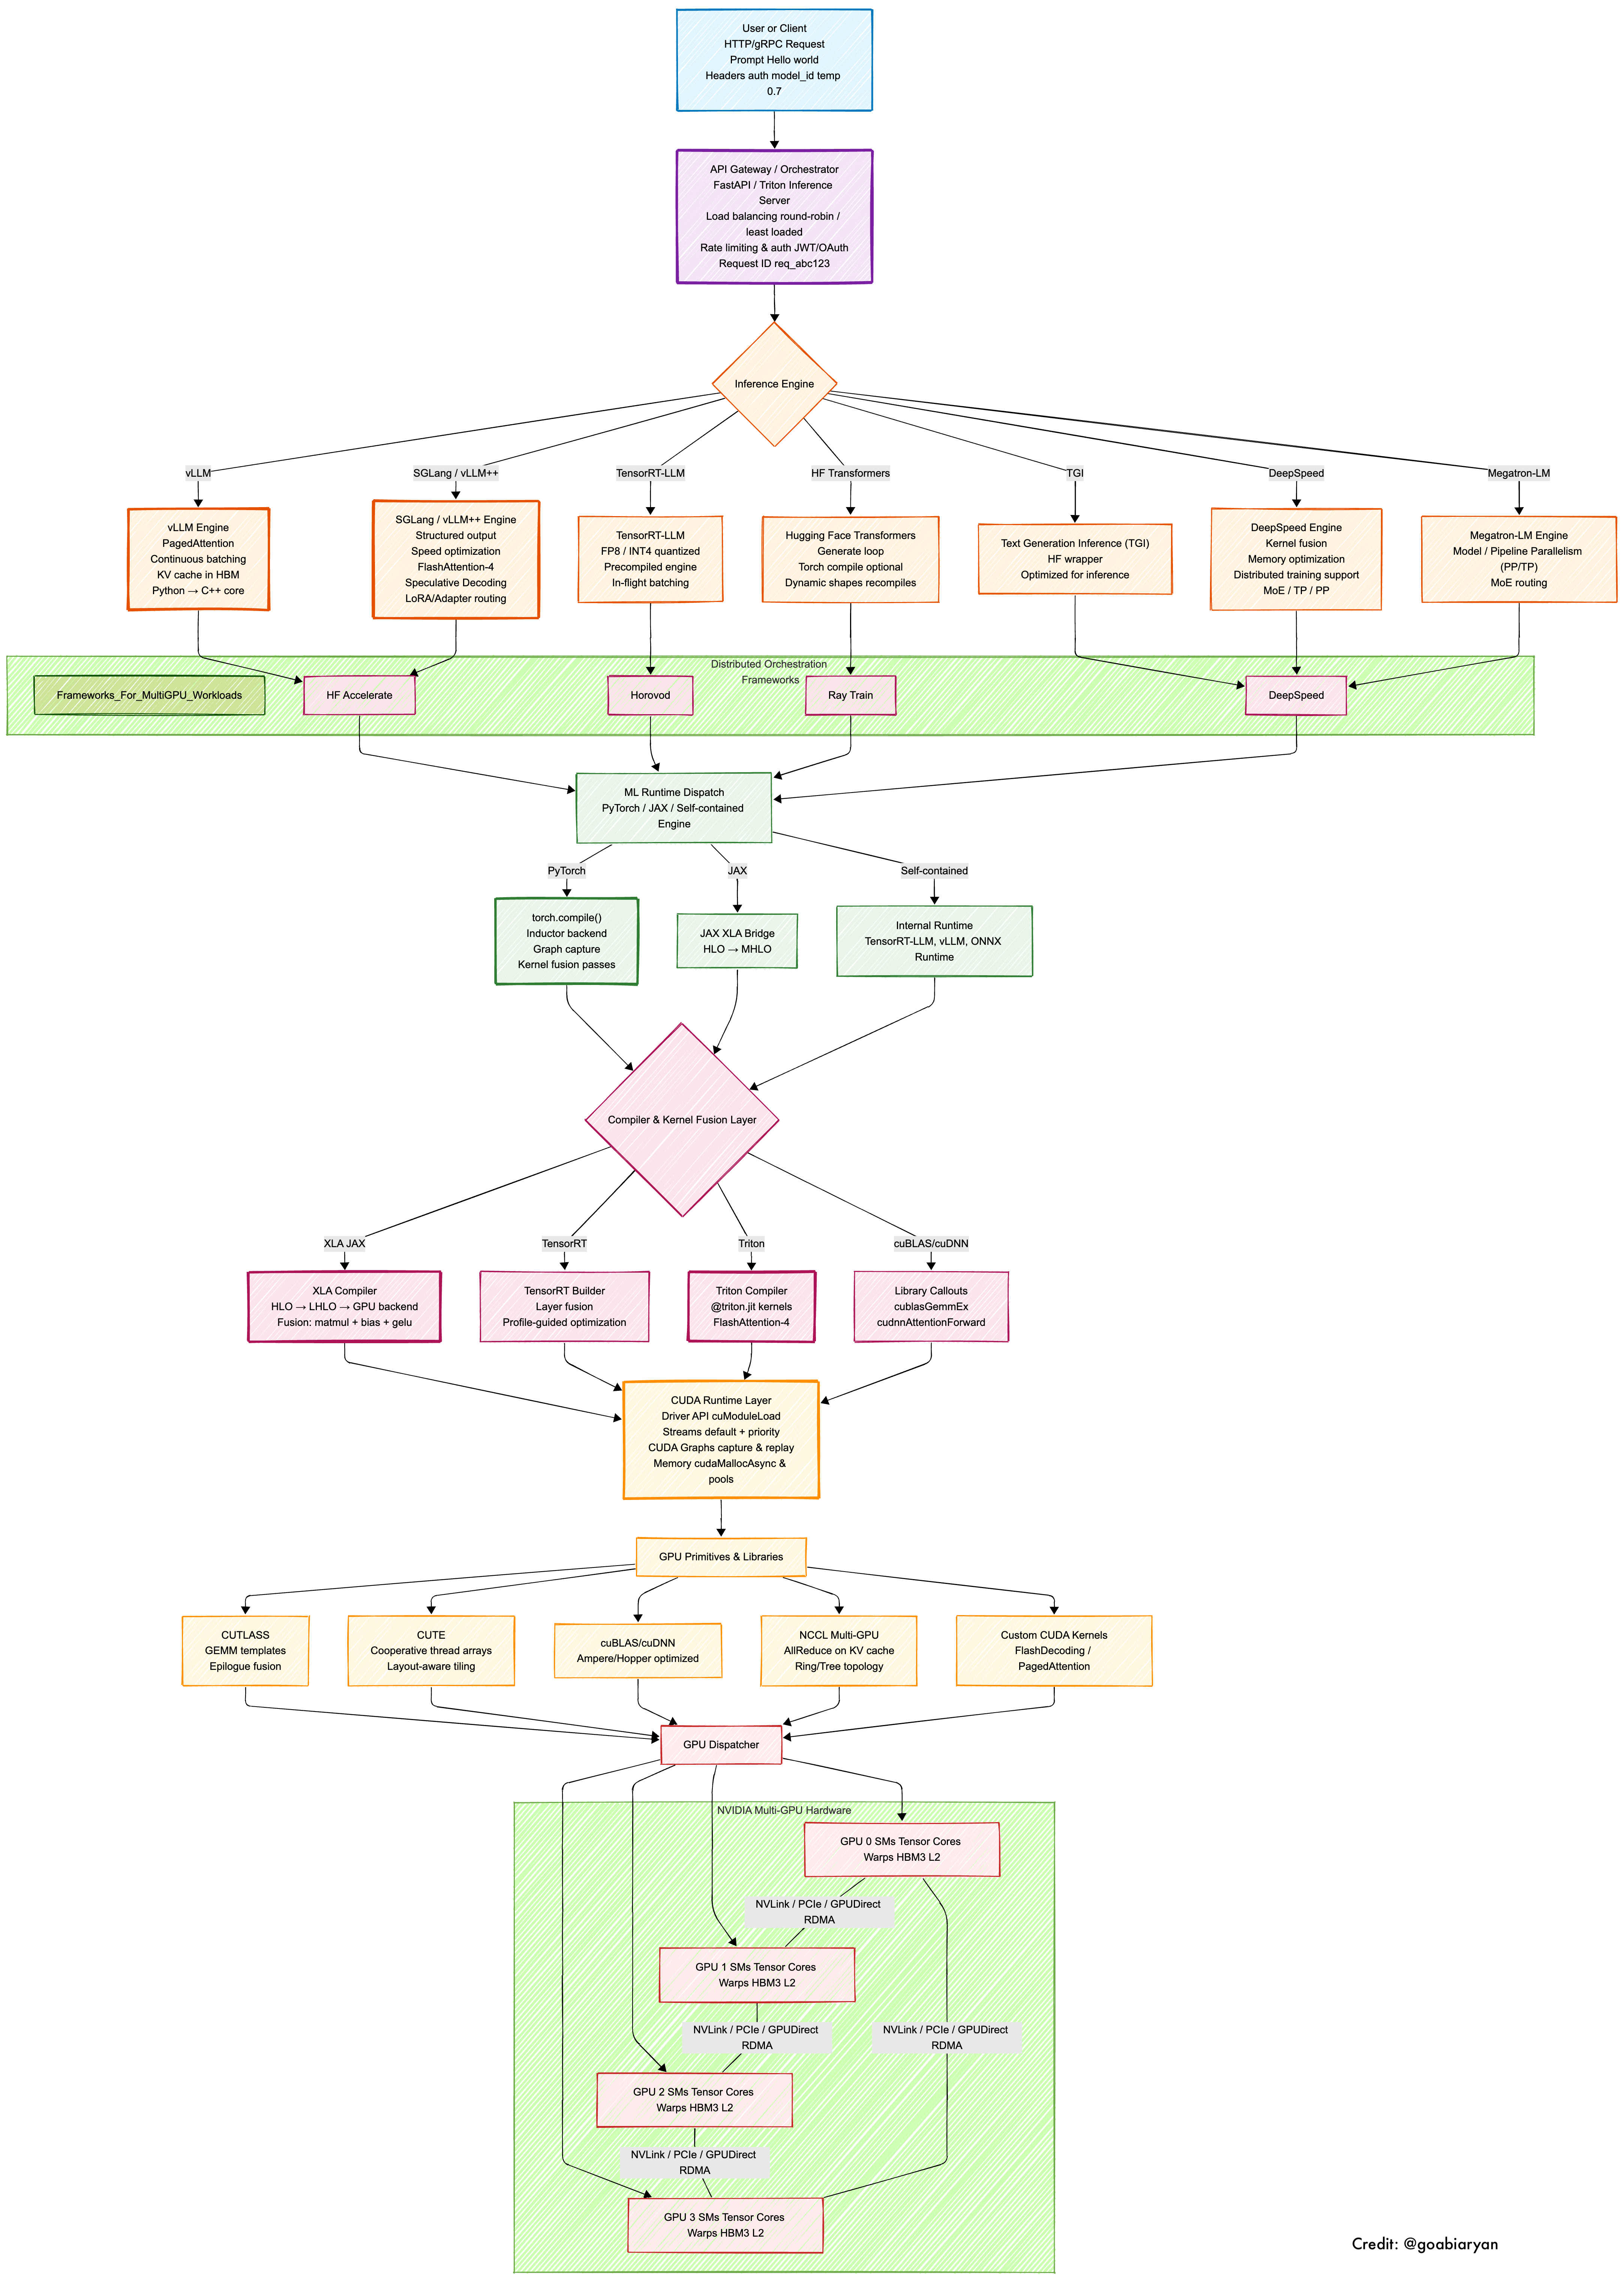
System overview
API gateway: Admits the request. Auth, rate limits, load balancing, a request ID. If this is slow, everything downstream is slow.
Inference engine: Executes the model. Continuous batching, KV cache (PagedAttention, chunked prefill), quantization, speculative decoding, LoRA routing.
Orchestration: Memory and communication across GPUs. Data, tensor, pipeline, and expert parallelism. Without this, extra cards sit idle.
Runtime and compiler: JIT, kernel fusion, graphs. Dynamic vs static execution.
CUDA primitives: Streams, memory pools, CUDA graphs. cuBLAS, cuDNN, CUTLASS, NCCL. Custom kernels for FlashDecoding and PagedAttention.
Hardware: SMs, Tensor Cores, HBM, NVLink, PCIe. Bandwidth, latency, and topology decide whether scale is real.
What I observed
Most tutorials stop at “call the API” or “run the model.” Then production happens and nobody can say which layer is lying.
This is the diagram of every layer from your request to multi-GPU execution. It is the map I wished I had.
Why I think this happened
Each layer can look healthy while the next one is the bottleneck. Miss the gateway and you debug vLLM for an auth timeout. Miss the interconnect and you buy more GPUs that sit idle. Miss KV cache and you think you have a compute problem.
GPU engineering, in this framing, is prompting for infrastructure: every choice (engine, framework, runtime, kernel, hardware) changes the tokens that come out.
Finding 1: Performance is a path
Claim. You cannot debug inference from the model card. You debug a path.
Evidence. The same weights on the same GPU change latency when request shape, batch mix, or interconnect changes, see the 3.3 second vs 39 second case on this site.
Explanation. Prefill and decode live in the engine. Placement lives in orchestration. Bytes per second live in HBM and NVLink.
Implication. Start at the layer that owns the symptom. Do not start at the kernel because the kernel is fashionable.
Finding 2: Skipping layers produces cargo-cult optimizations
Claim. Most public guides omit orchestration, compiler, CUDA, and hardware, so people apply the wrong lever.
Evidence. The popular path is “call the API” or “run generate().” The stack in Figure 1 has four layers under that.
Explanation. A quantization blog cannot fix a saturated allreduce. A kernel blog cannot fix a gateway without request IDs.
Implication. Learn the map before you collect tools. The reading order is gpuengineering.com.
Request
  → API gateway
  → Router / load balancer
  → Scheduler
  → Prefill
  → KV cache
  → Decode
  → GPU / interconnect
@article{abi2025,
title = "The Full Story of LLM Inference",
author= "Aryan, Abi",
journal = "abiaryan.com",
year = "2025",
month = "October",
url = "https://abiaryan.com/writing/llm-inference/"
}Practical guidance
- Draw the six layers for your stack. Name the software at each hop.
- Give every request an ID at the gateway. RelayServe exists so this is not optional in a lab.
- Split metrics by prefill and decode before you look at SM utilization.
- If you add a GPU, say which layer you expect to move, engine, orchestration, or interconnect.
- Read PMPP notes before another CUDA tutorial.
Limitations
This is an architecture map, not a benchmark of vLLM vs SGLang vs TensorRT-LLM. Engine names age; the layers do not. Disaggregated prefill/decode splits the engine layer across machines, the path still holds, the box boundaries move.